About the Insight Reports
The BizBuySell Insight Report is a nationally-recognized economic indicator that tracks the health of the U.S. small business economy. Each quarter, BizBuySell analyzes sales and listing prices of small businesses across the United States based on approximately 45,000businesses for sale and those recently sold. The BizBuySell Insight Reports focus on over 70 major U.S. markets and publish local, regional, state and national data for trending and analysis.
An expert on small business issues, Group General Manager of BizBuySell.com and BizQuest.com, Bob House, discusses the trends revealed by the Insight Reports in various media outlets.
Small Business Transactions Up 6 Percent Over Same Time Last Year, Median Cash Flow of Sold Businesses Reaches Record High
BizBuySell.com's First Quarter 2015 Insight Report shows strong transaction activity and robust business financials as the service and retail industries continue to drive market growth.
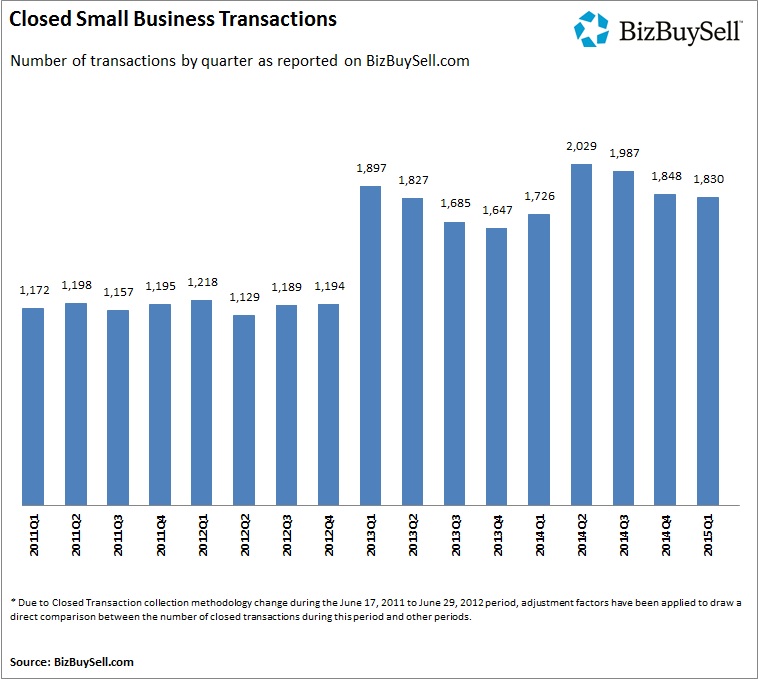
San Francisco, CA - BizBuySell.com the Internet's largest business-for-sale marketplace, reported today that small business transactions continued at a strong pace in the first quarter of 2015, growing 6 percent from the first quarter of 2014. A total of 1,830 small businesses were reported sold in Q1, continuing a two-year trend of exceptionally robust activity in the business-for-sale market. The full results are included in BizBuySell.com's Q1 2015 Insight Report, which aggregates statistics from business-for-sale transactions reported by participating business brokers nationwide.
Recent surveys of buyers, sellers and business brokers attribute the transaction increase to the growth of both supply and demand in the business-for-sale market. Baby Boomers continue to supply the market with quality listings as they reach retirement age and buyers (who now have access to more lending options) are pulling the trigger on their small business ownership plans.
A key reason buyers and sellers are entering the market in larger numbers is the improving health of small businesses in general. Financial indicators remained high in the first quarter of 2015, giving sellers hope that they can earn a high sales price and giving buyers optimism about the future of their potential acquisitions. The median revenue of small businesses sold in Q1 stood at $442,000, up from an even $400,000 at the same time last year. Median cash flow hit $104,000, which represents the highest median cash flow reported since BizBuySell.com started tracking this data in 2007.

Impressive financial performance is allowing sellers to ask for and receive higher prices for their businesses. The median asking price of a small business in Q1 was $225,000, a significant jump from the $199,000 median asking price recorded a year ago. The median sale price in Q1 2015 was $200,000, a marked increase from the $175,000 median sale price in Q1 2014-and a price that is consistent with the higher sale prices seen in the final quarter of 2014.

"We continue to see sustained growth in the business-for-sale market," Bob House, Group General Manager of BizBuySell.com and BizQuest.com, said. "It's now been more than two years of consistent financial improvement and we continue to reach new milestones each quarter. It's great to see that small business owners can grow and successfully sell in today's environment."
Service and Retail Businesses Drive Growth of Transactions, Financial Performance
Businesses in the service industry appear to have fueled transaction growth in Q1. The 711 service industry transactions recorded in Q1 2015 represent an 18 percent increase over Q1 2014. Broken down geographically, small businesses in the service sector were most popular in the Midwest region, where total transactions grew 63 percent from Q1 2014. Service industry sales were also up 35 percent in the Mountain region and 17 percent in the South.
Small businesses that specialize in retail sales saw the biggest gains in financial performance in early 2015. The median revenue of a retail business sold in Q1 of 2015 was $537,500, up from $437,783 in Q1 2014. Median cash flow for businesses in the retail sector grew from $89,907 to $99,355. Improved performance indicators also gave retail owners confidence to ask for and receive more for their businesses. The median asking price for retail businesses grew from $199,000 in the first quarter of 2014 to $220,000 in the first quarter of 2015, resulting in a significant increase in the median sale price, from $155,000 to $197,250.

Strong Revenue and Cash Flow Indicate Improving Small Business Environment in 2015
Transaction activity has been consistently strong since the beginning of 2013, but the financial performance of small businesses has been particularly robust in recent months. The median revenue of small businesses sold on BizBuySell.com spiked in mid-2014 and has remained strong since, hovering just below $450,000. At the same time, median cash flow has reached all-time highs in each of the last two quarters, peaking at $104,000 in Q1 2015.
Likewise, sales price multiples for both median revenue and median cash flow are trending upwards. The median revenue multiple for sold businesses in early 2015 was 0.63, up from 0.59 at the same time last year. The median cash flow multiple also grew slightly from 2.21 in Q1 2014 to 2.27 in Q1 2015. These increases point to a more balanced market, where both buyers and sellers receive value from transactions. The current, balanced market is expected to continue to drive interested buyers and sellers to the table throughout the remainder of 2015.

"We've heard from our broker customers that they are seeing more qualified buyers capable of taking over the reins from sellers, specifically Baby Boomers ready to retire," House said. "Supply and demand fundamentals, combined with the improving financial performance of small businesses in general, should drive growth through the rest of the year."
APPENDIX: Additional Statistics from Small Business Listings and Transactions Reported to BizBuySell
Media Resources
BizBuySell is the Internet's largest and most heavily trafficked business for sale marketplace, with more business for sale listings, more unique users, and more search activity than any other service.
Small Business Listing Metrics by Geography for First Quarter, 2015
Key metrics from businesses listed for sale on BizBuySell.com by market for Q1 2015
| Market | # of Businesses Listed | Median Asking Price | Median Revenue | Median Cash Flow | Asking Price to Revenue (average) | Asking Price to Cash Flow (average) |
|---|---|---|---|---|---|---|
| Albany-Schenectady-Troy, NY | 134 | $325,000 | $610,000 | $137,000 | 0.77 | 2.98 |
| Albuquerque, NM | 52 | $264,500 | $378,500 | $87,000 | 0.85 | 3.38 |
| Atlanta-Sandy Springs-Marietta, GA | 554 | $250,000 | $480,000 | $107,000 | 0.87 | 3.32 |
| Austin-Round Rock, TX | 202 | $259,000 | $400,000 | $112,944 | 0.89 | 3.00 |
| Baltimore-Towson, MD | 258 | $325,000 | $572,458 | $132,200 | 0.74 | 3.01 |
| Birmingham-Hoover, AL | 62 | $299,000 | $481,443 | $110,000 | 0.87 | 3.36 |
| Boston-Cambridge-Quincy, MA-NH | 476 | $209,000 | $450,000 | $109,750 | 0.62 | 2.42 |
| Bridgeport-Stamford-Norwalk, CT | 157 | $180,000 | $389,430 | $97,840 | 0.59 | 2.50 |
| Buffalo-Niagara Falls, NY | 36 | $226,000 | $453,263 | $100,000 | 0.71 | 3.12 |
| Charlotte-Gastonia-Concord, NC-SC | 186 | $245,000 | $498,134 | $97,500 | 0.66 | 3.22 |
| Chicago-Naperville-Joliet, IL-IN-WI | 625 | $265,000 | $500,000 | $118,000 | 0.79 | 3.09 |
| Cincinnati-Middletown, OH-KY-IN | 110 | $225,000 | $491,000 | $94,500 | 0.74 | 3.17 |
| Cleveland-Elyria-Mentor, OH | 74 | $249,500 | $420,740 | $100,000 | 0.68 | 2.96 |
| Columbus, OH | 157 | $175,000 | $367,000 | $80,744 | 0.67 | 2.89 |
| Contra Costa-Alameda-Solano, CA | 203 | $190,000 | $372,822 | $100,476 | 0.73 | 2.69 |
| Dallas-Fort Worth-Arlington, TX | 945 | $239,000 | $415,504 | $100,000 | 0.92 | 3.53 |
| Dayton, OH | 55 | $270,000 | $620,000 | $126,080 | 0.75 | 3.13 |
| Denver-Aurora, CO | 373 | $295,000 | $550,000 | $110,000 | 0.73 | 3.26 |
| Detroit-Warren-Livonia, MI | 139 | $220,000 | $420,000 | $95,200 | 0.75 | 3.23 |
| Durham, NC | 21 | $160,000 | $410,000 | $86,659 | 0.49 | 2.42 |
| Fresno, CA | 22 | $237,000 | $402,500 | $105,500 | 0.81 | 3.55 |
| Greensboro-High Point, NC | 46 | $194,950 | $462,000 | $103,500 | 0.78 | 2.96 |
| Hartford-West Hartford-East Hartford, CT | 170 | $179,900 | $451,806 | $96,764 | 0.54 | 2.60 |
| Honolulu, HI | 27 | $279,000 | $352,255 | $84,000 | 0.69 | 3.63 |
| Houston-Sugar Land-Baytown, TX | 502 | $250,000 | $450,000 | $104,101 | 0.80 | 3.02 |
| Indianapolis-Carmel, IN | 104 | $222,000 | $512,000 | $86,177 | 0.64 | 2.80 |
| Jacksonville, FL | 387 | $199,000 | $390,500 | $98,193 | 0.73 | 2.72 |
| Kansas City, MO-KS | 240 | $295,000 | $427,277 | $118,067 | 0.84 | 2.87 |
| Las Vegas-Paradise, NV | 306 | $175,000 | $346,000 | $90,042 | 0.68 | 2.32 |
| Los Angeles-Long Beach-Santa Ana, CA | 2,143 | $200,000 | $420,000 | $100,000 | 0.72 | 2.72 |
| Louisville-Jefferson County, KY-IN | 82 | $325,000 | $410,822 | $100,000 | 0.90 | 3.32 |
| Memphis, TN-MS-AR | 72 | $297,500 | $499,146 | $123,000 | 0.67 | 2.78 |
| Miami-Fort Lauderdale-Miami Beach, FL | 1,524 | $225,000 | $380,000 | $100,073 | 0.82 | 2.82 |
| Milwaukee-Waukesha-West Allis, WI | 64 | $325,000 | $583,500 | $118,731 | 0.83 | 3.55 |
| Minneapolis-St. Paul-Bloomington, MN-WI | 402 | $219,500 | $429,608 | $80,000 | 0.78 | 3.21 |
| Nashville-Davidson--Murfreesboro, TN | 249 | $169,000 | $368,000 | $85,000 | 0.72 | 2.77 |
| New Haven-Milford, CT | 145 | $219,000 | $458,000 | $107,615 | 0.63 | 2.83 |
| New Jersey | 1,867 | $265,000 | $445,778 | $109,000 | 0.80 | 3.00 |
| New Orleans-Metairie-Kenner, LA | 108 | $207,000 | $299,974 | $81,500 | 1.20 | 4.02 |
| New York-Northern New Jersey-Long Island, NY-NJ-PA | 5,425 | $299,000 | $575,000 | $131,600 | 0.69 | 2.69 |
| Oklahoma City, OK | 99 | $250,000 | $588,000 | $99,000 | 0.61 | 3.23 |
| Orange County, CA | 587 | $180,000 | $360,000 | $86,200 | 0.67 | 2.59 |
| Orlando-Kissimmee, FL | 674 | $183,500 | $365,928 | $91,481 | 0.72 | 2.73 |
| Philadelphia-Camden-Wilmington, PA-NJ-DE-MD | 833 | $285,000 | $490,800 | $116,678 | 0.82 | 3.09 |
| Phoenix-Mesa-Scottsdale, AZ | 1,190 | $169,000 | $324,263 | $75,000 | 0.70 | 2.66 |
| Pittsburgh, PA | 89 | $265,000 | $500,000 | $118,710 | 0.67 | 2.83 |
| Portland-Vancouver-Beaverton, OR-WA | 153 | $199,500 | $403,605 | $93,541 | 0.67 | 3.15 |
| Providence-New Bedford-Fall River, RI-MA | 141 | $199,000 | $400,000 | $91,966 | 0.68 | 3.05 |
| Raleigh-Cary, NC | 126 | $245,000 | $456,000 | $100,000 | 0.68 | 2.76 |
| Richmond, VA | 149 | $170,000 | $423,000 | $80,000 | 0.69 | 2.74 |
| Riverside-San Bernardino-Ontario, CA | 432 | $199,250 | $393,672 | $96,500 | 0.72 | 2.74 |
| Rochester, NY | 96 | $226,950 | $330,705 | $83,908 | 0.85 | 3.29 |
| Sacramento--Arden-Arcade--Roseville, CA | 275 | $169,000 | $317,176 | $85,000 | 0.69 | 2.52 |
| Salt Lake City, UT | 114 | $257,500 | $408,327 | $105,978 | 0.80 | 2.99 |
| San Antonio, TX | 162 | $262,500 | $538,318 | $117,644 | 0.83 | 3.44 |
| San Diego-Carlsbad-San Marcos, CA | 356 | $169,250 | $316,881 | $84,043 | 0.74 | 2.57 |
| San Francisco-Oakland-Fremont, CA | 316 | $250,000 | $462,513 | $109,651 | 0.90 | 3.02 |
| San Jose-Sunnyvale-Santa Clara, CA | 157 | $250,000 | $533,099 | $101,813 | 0.80 | 3.12 |
| Seattle-Tacoma-Bellevue, WA | 203 | $200,000 | $450,000 | $108,000 | 0.68 | 2.83 |
| St. Louis, MO-IL | 223 | $225,000 | $405,099 | $72,978 | 0.70 | 3.86 |
| Tampa-St. Petersburg-Clearwater, FL | 837 | $175,000 | $345,000 | $84,284 | 0.72 | 2.66 |
| Tucson, AZ | 119 | $199,000 | $397,553 | $84,252 | 0.71 | 3.17 |
| Tulsa, OK | 66 | $275,000 | $460,961 | $109,500 | 0.71 | 3.27 |
| Virginia Beach-Norfolk-Newport News, VA-NC | 130 | $200,000 | $360,000 | $76,866 | 0.74 | 3.05 |
| Washington-Arlington-Alexandria, DC-VA-MD-WV | 644 | $250,000 | $500,000 | $109,000 | 0.63 | 2.72 |
| Wichita, KS | 23 | $325,000 | $440,000 | $80,000 | 0.92 | 3.62 |
| Winston-Salem, NC | 18 | $261,000 | $452,500 | $94,648 | 0.67 | 2.76 |
Source: Small business transactions reported on BizBuySell.com during the first quarter of 2015
Closed Small Business Transaction Metrics by Geographic Market for the Full-Year 2014
Key metrics from transactions reported on BizBuySell.com by market during 2014
| Market | # of Reported Sales | Median Asking Price | Median Sale Price | Sales to Asking Price (average) | Median Revenue | Median Cash Flow | Revenue Multiple (average) | Cash Flow Multiple (average) |
|---|---|---|---|---|---|---|---|---|
| Albany-Schenectady-Troy, NY | 9 | $399,000 | $399,000 | 0.96 | $1,045,801 | $147,203 | 0.47 | 2.26 |
| Albuquerque, NM | 5 | $496,000 | $447,500 | 0.91 | $1,017,576 | $201,140 | 0.63 | 2.43 |
| Atlanta-Sandy Springs-Marietta, GA | 197 | $277,500 | $256,000 | 0.91 | $533,635 | $121,444 | 0.65 | 2.47 |
| Austin-Round Rock, TX | 65 | $154,100 | $137,500 | 0.93 | $323,838 | $107,582 | 0.63 | 2.09 |
| Baltimore-Towson, MD | 86 | $274,500 | $244,200 | 0.87 | $600,000 | $101,216 | 0.51 | 2.32 |
| Birmingham-Hoover, AL | 14 | $320,000 | $307,500 | 0.89 | $373,176 | $72,561 | 0.61 | 3.29 |
| Boston-Cambridge-Quincy, MA-NH | 229 | $198,000 | $175,000 | 0.89 | $442,459 | $115,000 | 0.50 | 2.09 |
| Bridgeport-Stamford-Norwalk, CT | 29 | $230,000 | $230,000 | 0.95 | $487,500 | $126,400 | 0.60 | 1.98 |
| Buffalo-Niagara Falls, NY | 11 | $267,450 | $250,000 | 0.94 | $522,500 | $98,000 | 0.62 | 3.43 |
| Charlotte-Gastonia-Concord, NC-SC | 67 | $255,500 | $231,250 | 0.94 | $496,040 | $120,235 | 0.63 | 2.53 |
| Chicago-Naperville-Joliet, IL-IN-WI | 226 | $179,000 | $150,000 | 0.85 | $436,000 | $83,623 | 0.49 | 2.26 |
| Cincinnati-Middletown, OH-KY-IN | 20 | $197,000 | $180,000 | 0.92 | $545,168 | $88,632 | 0.51 | 2.21 |
| Cleveland-Elyria-Mentor, OH | 20 | $350,000 | $300,000 | 0.86 | $450,000 | $129,000 | 0.60 | 2.86 |
| Columbus, OH | 45 | $132,450 | $116,500 | 0.78 | $286,778 | $72,120 | 0.48 | 2.02 |
| Dallas-Fort Worth-Arlington, TX | 196 | $225,000 | $225,000 | 0.92 | $419,000 | $110,000 | 0.67 | 2.39 |
| Dayton, OH | 11 | $420,492 | $360,000 | 0.83 | $701,000 | $194,275 | 0.80 | 2.67 |
| Denver-Aurora, CO | 134 | $225,000 | $225,000 | 0.94 | $550,000 | $104,000 | 0.57 | 2.14 |
| Detroit-Warren-Livonia, MI | 83 | $225,000 | $200,000 | 0.90 | $382,908 | $89,385 | 0.65 | 2.52 |
| Durham, NC | 6 | $69,995 | $60,000 | 0.80 | $376,174 | $54,000 | 0.55 | 1.72 |
| Fresno, CA | 6 | |||||||
| Greensboro-High Point, NC | 13 | $304,000 | $256,750 | 0.84 | $934,000 | $150,803 | 0.68 | 2.58 |
| Hartford-West Hartford-East Hartford, CT | 41 | $199,000 | $199,000 | 0.93 | $350,000 | $74,400 | 0.49 | 2.05 |
| Honolulu, HI | 11 | $250,000 | $280,000 | 0.95 | $416,894 | $153,603 | 0.71 | 2.31 |
| Houston-Sugar Land-Baytown, TX | 131 | $207,000 | $187,500 | 0.93 | $379,424 | $89,188 | 0.60 | 2.24 |
| Indianapolis-Carmel, IN | 53 | $243,900 | $217,000 | 0.89 | $628,100 | $107,994 | 0.42 | 2.17 |
| Jacksonville, FL | 33 | $149,900 | $146,500 | 0.90 | $362,204 | $107,226 | 0.54 | 2.16 |
| Kansas City, MO-KS | 36 | $282,500 | $275,000 | 0.95 | $533,000 | $113,500 | 0.60 | 2.23 |
| Las Vegas-Paradise, NV | 56 | $150,000 | $122,500 | 0.90 | $314,623 | $76,326 | 0.49 | 1.72 |
| Los Angeles-Long Beach-Santa Ana, CA | 717 | $199,000 | $189,000 | 0.95 | $420,000 | $90,307 | 0.64 | 2.45 |
| Louisville-Jefferson County, KY-IN | 20 | $207,000 | $167,500 | 0.88 | $437,500 | $83,500 | 0.59 | 2.66 |
| Memphis, TN-MS-AR | 28 | $255,000 | $215,000 | 0.84 | $690,500 | $136,528 | 0.51 | 2.24 |
| Miami-Fort Lauderdale-Miami Beach, FL | 300 | $165,000 | $150,000 | 0.89 | $320,249 | $96,338 | 0.61 | 2.04 |
| Milwaukee-Waukesha-West Allis, WI | 24 | $225,000 | $159,250 | 0.84 | $489,580 | $87,741 | 0.41 | 2.21 |
| Minneapolis-St. Paul-Bloomington, MN-WI | 31 | $225,000 | $175,000 | 0.90 | $453,346 | $80,000 | 0.55 | 2.51 |
| Nashville-Davidson--Murfreesboro, TN | 94 | $237,000 | $192,500 | 0.87 | $417,791 | $100,000 | 0.52 | 2.23 |
| New Haven-Milford, CT | 20 | $203,500 | $135,000 | 0.83 | $463,441 | $95,350 | 0.53 | 2.01 |
| New Orleans-Metairie-Kenner, LA | 10 | $275,000 | $186,010 | 0.94 | $760,000 | $100,000 | 0.37 | 2.83 |
| New York-Northern New Jersey-Long Island, NY-NJ-PA | 455 | $222,000 | $200,000 | 0.92 | $416,000 | $120,000 | 0.68 | 2.13 |
| Oklahoma City, OK | 17 | $417,500 | $360,000 | 0.87 | $614,821 | $132,001 | 0.62 | 2.16 |
| Orlando-Kissimmee, FL | 194 | $165,000 | $144,500 | 0.89 | $306,095 | $83,196 | 0.56 | 1.81 |
| Philadelphia-Camden-Wilmington, PA-NJ-DE-MD | 185 | $252,500 | $238,125 | 0.92 | $505,000 | $114,025 | 0.65 | 2.34 |
| Phoenix-Mesa-Scottsdale, AZ | 195 | $185,000 | $157,500 | 0.91 | $378,332 | $97,064 | 0.61 | 2.01 |
| Pittsburgh, PA | 18 | $437,500 | $413,500 | 0.92 | $511,104 | $143,037 | 0.69 | 2.88 |
| Portland-Vancouver-Beaverton, OR-WA | 66 | $200,000 | $200,000 | 0.91 | $470,670 | $84,046 | 0.64 | 2.54 |
| Providence-New Bedford-Fall River, RI-MA | 32 | $350,000 | $250,000 | 0.88 | $696,000 | $129,228 | 0.88 | 2.70 |
| Raleigh-Cary, NC | 52 | $260,000 | $225,000 | 0.90 | $376,470 | $125,280 | 0.66 | 2.18 |
| Richmond, VA | 26 | $212,500 | $177,500 | 0.92 | $487,500 | $98,500 | 0.39 | 2.09 |
| Riverside-San Bernardino-Ontario, CA | 97 | $182,250 | $160,000 | 0.93 | $400,153 | $83,000 | 0.61 | 2.15 |
| Rochester, NY | 4 | $189,000 | $175,000 | 0.86 | $211,000 | $101,000 | 0.83 | 1.55 |
| Sacramento--Arden-Arcade--Roseville, CA | 40 | $176,500 | $190,000 | 0.97 | $272,700 | $67,225 | 0.87 | 2.56 |
| Salt Lake City, UT | 53 | $200,000 | $183,750 | 0.90 | $366,341 | $103,920 | 0.61 | 2.28 |
| San Antonio, TX | 50 | $148,000 | $120,000 | 0.89 | $415,999 | $77,000 | 0.61 | 2.05 |
| San Diego-Carlsbad-San Marcos, CA | 164 | $175,000 | $165,000 | 0.94 | $300,000 | $81,548 | 0.79 | 2.17 |
| San Francisco-Oakland-Fremont, CA | 86 | $198,000 | $180,000 | 0.91 | $229,775 | $100,426 | 0.91 | 2.08 |
| San Jose-Sunnyvale-Santa Clara, CA | 33 | $149,000 | $130,000 | 0.95 | $354,664 | $81,109 | 0.60 | 2.35 |
| Seattle-Tacoma-Bellevue, WA | 89 | $325,000 | $300,000 | 0.90 | $673,852 | $143,588 | 0.52 | 2.58 |
| St. Louis, MO-IL | 23 | $133,500 | $132,900 | 0.89 | $280,000 | $100,154 | 0.30 | 1.65 |
| Tampa-St. Petersburg-Clearwater, FL | 245 | $139,000 | $120,000 | 0.91 | $311,973 | $83,090 | 0.55 | 1.85 |
| Tucson, AZ | 23 | $127,500 | $115,750 | 0.89 | $352,993 | $73,690 | 0.46 | 1.98 |
| Tulsa, OK | 13 | $340,000 | $227,500 | 0.83 | $432,622 | $151,250 | 0.60 | 2.23 |
| Virginia Beach-Norfolk-Newport News, VA-NC | 40 | $189,000 | $173,500 | 0.86 | $471,714 | $81,923 | 0.53 | 2.45 |
| Washington-Arlington-Alexandria, DC-VA-MD-WV | 161 | $216,163 | $179,400 | 0.86 | $477,500 | $103,500 | 0.45 | 1.95 |
| Wichita, KS | 7 | $235,000 | $200,000 | 0.88 | $230,000 | $108,000 | 1.11 | 3.55 |
| Winston-Salem, NC | 7 | $435,000 | $447,500 | 0.98 | $1,887,000 | $153,000 | 0.46 | 3.36 |
| Orange County, CA | 222 | $160,000 | $150,000 | 0.94 | $363,000 | $82,800 | 0.58 | 2.21 |
| Contra Costa-Alameda-Solano, CA | 30 | $191,500 | $182,500 | 0.93 | $576,216 | $114,500 | 0.70 | 2.09 |
| New Jersey | 196 | $236,900 | $223,500 | 0.93 | $480,650 | $120,000 | 0.60 | 2.26 |
Source: Small business transactions reported on BizBuySell.com during 2014
Closed Small Business Transaction Metrics by Sector for the Full-Year 2014
Key metrics from transactions reported on BizBuySell.com by sector during 2014
| Sector | Sub-Sector | Number of Reported Sales | Median Sales Price | Median Asking Price | Sales to Asking Price (average) | Median Revenue | Revenue Multiple (average) | Median Cash Flow | Cash Flow Multiple (average) |
|---|---|---|---|---|---|---|---|---|---|
| Agriculture | Agriculture | 6 | $1,687,500 | $1,900,000 | 0.88 | $3,567,833 | 0.55 | $776,817 | 2.26 |
| Communications | Communications | 10 | $221,000 | $285,000 | 0.94 | $336,204 | 0.55 | $122,056 | 2.23 |
| Construction | Construction-Building | 15 | $237,500 | $264,500 | 0.96 | $748,526 | 0.49 | $136,876 | 2.10 |
| Construction-Heavy | 4 | $920,000 | $950,000 | 0.73 | $738,215 | 1.09 | $320,000 | 3.09 | |
| Construction-Special Trades | 94 | $425,000 | $450,000 | 0.90 | $813,000 | 0.50 | $200,000 | 2.32 | |
| Electric, Gas, Water, Sanitary Svcs | Electric, Gas, Water, Sanitary Svcs | 7 | $250,000 | $275,000 | 0.91 | $530,000 | 0.82 | $160,000 | 2.58 |
| Internet | Business Services (B2B) | 58 | $237,000 | $249,500 | 0.92 | $248,056 | 1.25 | $90,627 | 2.50 |
| Consumer Services (B2C) | 94 | $137,000 | $150,000 | 0.90 | $225,528 | 0.91 | $68,422 | 2.09 | |
| Domain Name/Basic Site | 4 | $120,000 | $120,000 | 0.68 | $308,294 | 0.69 | $89,786 | 1.25 | |
| General Internet | 42 | $124,900 | $135,000 | 0.97 | $128,177 | 1.34 | $61,298 | 2.23 | |
| Software | 27 | $175,000 | $210,000 | 0.89 | $110,564 | 1.61 | $85,776 | 2.53 | |
| Web Design/Tech Services | 10 | $298,800 | $298,800 | 0.94 | $381,600 | 0.79 | $138,000 | 2.15 | |
| Manufacturing | Apparel & finished fabrics | 14 | $275,000 | $595,000 | 0.83 | $605,000 | 0.49 | $100,000 | 2.37 |
| Chemicals & Allied Products | 8 | $900,000 | $925,000 | 0.87 | $1,511,783 | 0.57 | $240,500 | 3.16 | |
| Electronic & Electrical Equip. | 10 | $665,000 | $1,008,750 | 0.78 | $1,169,000 | 0.67 | $375,000 | 2.37 | |
| Fabricated Metal Products | 60 | $750,000 | $1,000,000 | 0.88 | $1,200,000 | 0.71 | $333,000 | 2.81 | |
| Food and Kindred Products | 26 | $286,000 | $295,000 | 0.88 | $400,000 | 0.79 | $90,000 | 2.86 | |
| Furniture and Fixtures | 17 | $450,000 | $575,000 | 0.88 | $1,100,000 | 0.44 | $186,293 | 2.79 | |
| Industrial & Comm. Machinery | 10 | $480,000 | $495,000 | 0.98 | $900,000 | 0.81 | $271,000 | 3.62 | |
| Lumber and Wood Products | 11 | $400,000 | $450,000 | 0.94 | $1,073,146 | 0.49 | $208,332 | 2.51 | |
| Measuring & Analyzing Instr. | 3 | $606,250 | $659,500 | 0.91 | $808,201 | 1.05 | $194,445 | 3.14 | |
| Miscellaneous | 45 | $424,995 | $449,995 | 0.92 | $751,327 | 0.78 | $187,500 | 2.67 | |
| Paper & Allied Products | 3 | $70,000 | $79,000 | 0.93 | $111,434 | 0.79 | $42,011 | 2.49 | |
| Primary Metal Industries | 11 | $1,127,500 | $1,242,000 | 0.89 | $1,625,000 | 0.69 | $340,406 | 3.11 | |
| Printing, Publishing | 45 | $220,000 | $225,000 | 0.89 | $364,000 | 0.58 | $93,122 | 2.10 | |
| Rubber and Plastic Products | 11 | $720,000 | $850,000 | 0.93 | $581,000 | 0.83 | $172,200 | 3.46 | |
| Stone, Clay, Glass, Concrete | 8 | $316,000 | $325,000 | 1.28 | $922,658 | 0.45 | $138,994 | 2.56 | |
| Textile Mill Products | 2 | $850,000 | $850,000 | 1.00 | $1,642,547 | 0.52 | $177,875 | 4.78 | |
| Tobacco Products | 2 | $77,500 | $87,500 | 0.88 | $498,023 | 0.29 | $75,728 | 1.33 | |
| Transportation Equipment | 7 | $1,692,500 | $1,725,000 | 0.92 | $2,035,820 | 0.70 | $258,450 | 4.80 | |
| Retail | Restaurants | 1546 | $150,000 | $169,000 | 0.89 | $480,000 | 0.39 | $94,070 | 1.96 |
| Apparel and Accessory Stores | 73 | $195,000 | $199,500 | 0.91 | $440,000 | 0.47 | $88,826 | 2.13 | |
| Automotive Dealers | 37 | $500,000 | $495,000 | 0.99 | $2,100,000 | 0.37 | $200,000 | 3.02 | |
| Bars/Taverns | 268 | $225,000 | $250,000 | 0.88 | $588,000 | 0.48 | $100,000 | 2.41 | |
| Blding Mat., Hardware, Garden | 26 | $209,000 | $212,500 | 0.94 | $468,581 | 0.64 | $99,902 | 2.45 | |
| Convenience Stores | 266 | $140,000 | $150,000 | 0.89 | $540,000 | 0.36 | $94,000 | 2.07 | |
| Florists | 38 | $100,000 | $144,000 | 0.87 | $334,598 | 0.37 | $65,320 | 1.78 | |
| Gasoline Service Stations | 263 | $240,000 | $249,000 | 0.92 | $751,800 | 0.47 | $134,497 | 2.74 | |
| General Merchandise Stores | 34 | $98,000 | $100,000 | 0.90 | $464,854 | 0.35 | $73,500 | 1.84 | |
| Home Furniture & Furnishings | 30 | $225,000 | $275,000 | 0.84 | $600,000 | 0.38 | $120,000 | 2.64 | |
| Liquor Stores | 282 | $300,000 | $342,500 | 0.93 | $765,000 | 0.50 | $120,000 | 2.96 | |
| Marine Dealers & Equipment | 9 | $540,000 | $500,000 | 0.95 | $352,382 | 1.27 | $95,893 | 4.49 | |
| Miscellaneous Retail | 245 | $165,000 | $199,000 | 0.88 | $377,367 | 0.48 | $86,882 | 2.02 | |
| Other Eating & Drinking Places | 285 | $125,000 | $149,900 | 0.88 | $315,000 | 0.43 | $72,000 | 1.90 | |
| Other Food Stores | 64 | $118,800 | $130,000 | 0.92 | $300,000 | 0.54 | $76,000 | 1.99 | |
| Pet Shops & Supplies | 15 | $161,000 | $199,999 | 0.96 | $340,000 | 0.64 | $70,000 | 2.44 | |
| Supermarkets | 49 | $395,000 | $399,000 | 0.97 | $820,000 | 0.69 | $150,000 | 3.57 | |
| Vending Machines | 84 | $115,000 | $125,000 | 0.91 | $329,992 | 0.62 | $60,661 | 2.02 | |
| Service | Agents & Brokers | 34 | $118,800 | $125,000 | 0.88 | $126,000 | 1.15 | $51,200 | 2.41 |
| Amusement & Recreation | 58 | $190,000 | $197,500 | 0.90 | $297,312 | 0.80 | $77,705 | 2.50 | |
| Auto Repair, Parts & Services | 234 | $265,000 | $299,000 | 0.94 | $621,000 | 0.66 | $135,312 | 2.53 | |
| Beauty Salons, Barber Shops | 227 | $94,800 | $99,000 | 0.91 | $208,698 | 0.45 | $64,311 | 1.75 | |
| Computer & Software Services | 35 | $265,000 | $275,000 | 0.89 | $396,273 | 0.80 | $102,511 | 2.47 | |
| Drycleaning/Laundry Services | 289 | $175,000 | $192,500 | 0.91 | $204,000 | 0.91 | $74,735 | 2.68 | |
| Educational Services | 96 | $160,250 | $175,000 | 0.93 | $348,854 | 0.70 | $85,000 | 2.50 | |
| Engineering & Accounting Svcs | 52 | $195,000 | $195,000 | 0.94 | $304,000 | 0.88 | $120,000 | 2.15 | |
| Finance, Banking, Loans, etc. | 23 | $386,750 | $392,500 | 0.92 | $441,500 | 1.06 | $178,500 | 2.21 | |
| Freight, Moving/Delivery | 104 | $355,000 | $389,999 | 0.92 | $500,000 | 0.73 | $144,000 | 2.56 | |
| Health, Medical & Dental | 254 | $280,000 | $299,000 | 0.91 | $497,988 | 0.70 | $145,410 | 2.28 | |
| Hotels & Other Lodging Places | 62 | $187,500 | $245,000 | 0.92 | $272,954 | 1.43 | $100,846 | 3.18 | |
| Landscaping & Yard Services | 118 | $142,500 | $160,000 | 0.94 | $206,279 | 0.65 | $90,244 | 1.67 | |
| Legal Services | 8 | $175,000 | $175,000 | 0.90 | $143,375 | 1.03 | $99,865 | 1.99 | |
| Marine Repair, Parts & Services | 8 | $325,000 | $399,000 | 0.85 | $485,653 | 0.80 | $168,585 | 2.03 | |
| Membership Organizations | 6 | $125,000 | $150,000 | 0.80 | $182,000 | 0.65 | $45,596 | 2.92 | |
| Miscellaneous Repair Services | 61 | $210,000 | $225,000 | 0.89 | $495,000 | 0.54 | $121,000 | 2.13 | |
| Miscellaneous Services | 273 | $175,000 | $197,000 | 0.91 | $322,213 | 0.70 | $103,583 | 2.08 | |
| Motion Pictures | 2 | $280,000 | $350,000 | 0.80 | $650,000 | 0.43 | $150,000 | 1.87 | |
| Museums, Art Galleries, Zoos | 6 | $85,000 | $99,000 | 0.86 | $180,000 | 0.47 | $47,000 | 1.71 | |
| Other Business Services | 347 | $250,000 | $272,500 | 0.94 | $444,651 | 0.68 | $116,654 | 2.44 | |
| Other Personal Services | 209 | $72,000 | $72,000 | 0.96 | $105,400 | 0.70 | $73,000 | 1.38 | |
| Other Travel & Transportation | 24 | $375,000 | $425,000 | 0.96 | $598,000 | 0.70 | $200,000 | 2.36 | |
| Passenger Transportation | 21 | $275,000 | $275,000 | 0.96 | $363,000 | 0.86 | $125,050 | 2.37 | |
| Pet Care & Grooming | 44 | $172,500 | $193,500 | 0.91 | $350,000 | 0.81 | $101,542 | 2.35 | |
| Social Services | 4 | $290,000 | $300,000 | 0.97 | $177,551 | 1.63 | $41,345 | 7.01 | |
| Storage & Warehousing | 10 | $2,662,500 | $2,775,000 | 0.91 | $1,050,583 | 2.28 | $380,443 | 6.32 | |
| Travel Agencies | 6 | $162,500 | $165,000 | 0.94 | $251,606 | 0.77 | $77,627 | 2.07 | |
| Wholesale | Durable Goods | 60 | $420,000 | $463,650 | 0.92 | $1,072,000 | 0.61 | $183,290 | 2.73 |
| Nondurable Goods | 91 | $135,000 | $143,000 | 0.92 | $403,312 | 0.49 | $70,737 | 2.20 | |
| Other | Non-classifiable Establishments | 6 | $500,000 | $650,000 | 0.91 | $649,792 | 1.54 | $90,000 | 3.58 |
Source: Small business transactions reported on BizBuySell.com during 2014
For additional information regarding Florida business sales, acquisitions and valuations, please contact Eric J. Gall at Eric@EdisonAvenue.com or 239.738.6227. Also, visit our Edison Avenue website at www.EdisonAvenue.com or my personal website at www.BuySellFLbiz.com.
No comments:
Post a Comment